Section 2: Weather Forecasts
A meteorologist is a scientist who studies the causes of weather and tries to predict it. They use maps, charts, and computers to analyze data to prepare weather forecasts. A weather map is a quick snapshot of conditions at a particular time over a large area. Data from weather stations all over the country are collected and analyzed to create a weather map. This map uses standard symbols to show information such as temperature, fronts, precipitation, and changes in air pressure. A surface report describes a set of weather measurements on the Earth’s surface, whereas an upper-air report describes the wind, temperature, and humidity conditions above Earth’s surface.

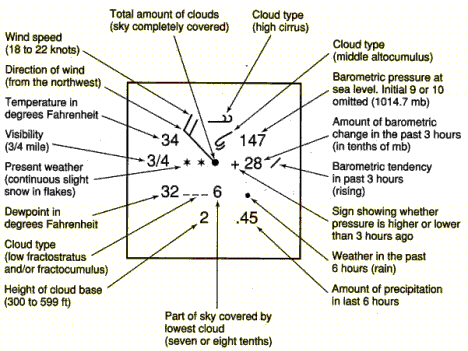
Meteorologists use Doppler radar to help predict the weather. Doppler radar is a specialized type of radar that can detect precipitation and the movement of small particles, which can be used to approximate wind speed. This ability to estimate wind speed can be helpful during severe weather. Station models are diagrams that display data from many different weather measurements for a particular location. On weather maps, you also see isobars and isotherms. Isobars are lines joining places on a map with the same air pressure. Isotherms are lines joining areas that have the same temperature.
Review:
- What is a scientist who studies weather called?
- What is Doppler Radar?
- Compare isotherms to isobars.
